Redseer x TikTokSaudi Arabia Impact Series2026Methodology
Methodology
Research design, scope, modelling approach and limitations for the economy and upskilling chapters.
Scope
What this series measures
The series reports three kinds of number. Each answers a different question and each is built a different way. They are shown side by side and are never added together.
SAR 10.7 Bn
Value added
How much activity in the Saudi economy is linked to businesses using the platform.
52 K
Jobs supported
Work across those businesses, their suppliers, and the spending of the people they employ.
345 Mn
Learning hours
How many hours a year people spend watching content that teaches or explains a skill.
How the learning hours are measured
The platform records time spent on content it classifies as learning and reports it to Redseer in aggregate. The recorded series covers 304 of 365 days, and is scaled to a full year and adjusted to an adult basis by removing users aged under 16. That gives 345 Mn hours. The measure counts time spent rather than training delivered.
Money and time are not the same thing. The learning hours measure time people spend, not money they earn, so they sit outside the SAR 10.7 Bn.
Surveys and samples
Surveys and samples
Every survey finding in the series comes from one of these. Each figure in a chapter is reported against the group that answered that question, not against the whole sample.
SurveyPeople askedWhat it is used for
Upskilling500How people find and act on new skills, and what stops them going further.
Business452Small and medium businesses using the platform for marketing. Used in the economic model.
How the samples were built
Both ran online through a managed panel. Two rules applied to everyone: aged 16 or over, and living in a household with a monthly income of SAR 3,000 or more. Quotas were set on age, gender, nationality, income and region, so the sample matches the shape of that population.
Each questionnaire was tested before launch. During fielding, answers were checked for people rushing, giving the same answer to every question, or contradicting themselves. Those responses were removed.
How precise the findings are
These are opt-in online panels, not probability samples of the population, so a standard margin of error does not strictly apply. Findings on a full sample of 452 to 500 are indicative to within a few percentage points. Findings on smaller groups carry much wider uncertainty, and differences of a few points between subgroups should not be read as real.
National scaling
Scaling survey findings to national estimates
When a chapter gives a number of people rather than a percentage, that number comes from applying a survey result to a population base.
For findings about what people do on TikTok, the base is built from the GASTAT 2024 population aged 13 and over, the survey-measured share who use TikTok, and the removal of those aged under 16, since the platform’s minimum age is 13. The upskiller figure in the upskilling chapter is built this way and the chapter states its own working.
Numbers built this way are indicative. They carry the error of the survey and the error of the population estimate together, and should be read as an approximate scale rather than an exact count.
Impact framework
Economic impact framework
The model starts with what businesses spend on advertising, turns that into the sales it produced, then follows those sales through the economy. It covers seventeen sectors and includes large companies and small businesses together.
The starting data are the volume of advertising activity by businesses on the platform, a measure of the sales that activity produced, and the sector mapping that places each business in the national accounts. Those inputs are supplied by TikTok at a category level and cross-checked against the business survey, in which respondents set out their marketing spend by channel alongside order values and sales volumes. The exact commercial values are not published.
What businesses get for free is counted too
Businesses use tools that cost them nothing: publishing content, creating it, and measuring whether it worked. Because no money changes hands, none of that appears in the national accounts. The business survey asked firms what they would pay each month to keep those tools if they stopped being free, and that stated value is converted into the additional sales it represents. Those sales are added to the advertising-driven revenue before anything flows through the economy, so the value of the free tools is included in the totals rather than reported separately.
Sales then travel through the economy by three routes
Direct
Value created by the businesses themselves, after taking out what they buy from others.
Indirect
Value created by their suppliers as those businesses order more.
Induced
Value created when the people employed along that chain spend their wages.
Jobs are worked out by taking the output in each route and dividing it by how much output one worker produces in that sector. Jobs are counted as headcount.
Result, 2025National total
Revenue upliftSAR 8.94 Bn
Gross value addedSAR 10.67 Bn
Jobs supported52,200
Converted from USD at 3.75. Sector lines are summed from the model rather than split out of the national total, so components may not add exactly because of rounding. Education and training draws SAR 205 Mn and 600 jobs.
Scope and exclusions
Scope and exclusions
Sales moved from somewhere else. The figures are gross. If a sale moved from another shop rather than being new, the model does not take it out.
What the money would have done elsewhere. The model does not ask what those businesses would have earned by spending the same budget on another channel.
Taxes and subsidies. These are not calculated. Gross value added is used in place of GDP contribution throughout.
Each of these would make the figures lower rather than higher. The estimate is deliberately conservative.
Reading the estimates
How to read the estimates
People are describing themselves. Survey answers record what someone remembers doing and what they credit it to. That is their own judgement, not a measured result.
Link, not cause. Someone saying content influenced a purchase does not prove the purchase would not have happened anyway.
Jobs are supported, not created. The figure counts work linked to the activity measured. It is not a count of new jobs.
Group sizes change from question to question. A finding from 500 people is firmer than one from 167. Every figure carries its base in the chapter or the note.
Small groups have no numbers. Anything answered by fewer than fifty people is shown as a direction, without a value.
No other platform is named. Comparisons are with digital media as a whole.
Evidence classes used across the series
National statistics.Published figures from GASTAT, GOSI, the Ministry of Tourism and the Vision 2030 Annual Report.
Self-reported survey.What respondents said about their own behaviour and what they credited it to.
Redseer modelled estimate.Built from survey incidence, population and published statistics under stated assumptions.
TikTok programme evidence.Participation and outputs from a structured partnership, with its own period and base.
Official advertiser case.Metrics an advertiser has published about its own campaign. Never generalised.
Emerging model.A partnership structure without realised outcomes. Never placed in a results section.
Who commissioned this work
TikTok commissioned this series. TikTok supplied platform inputs at a category level, including advertising activity, return on advertising spend and time spent on learning content, and those inputs are identified wherever they are used. Redseer designed the research, selected the methods, and is responsible for the estimates and the interpretation in every chapter.
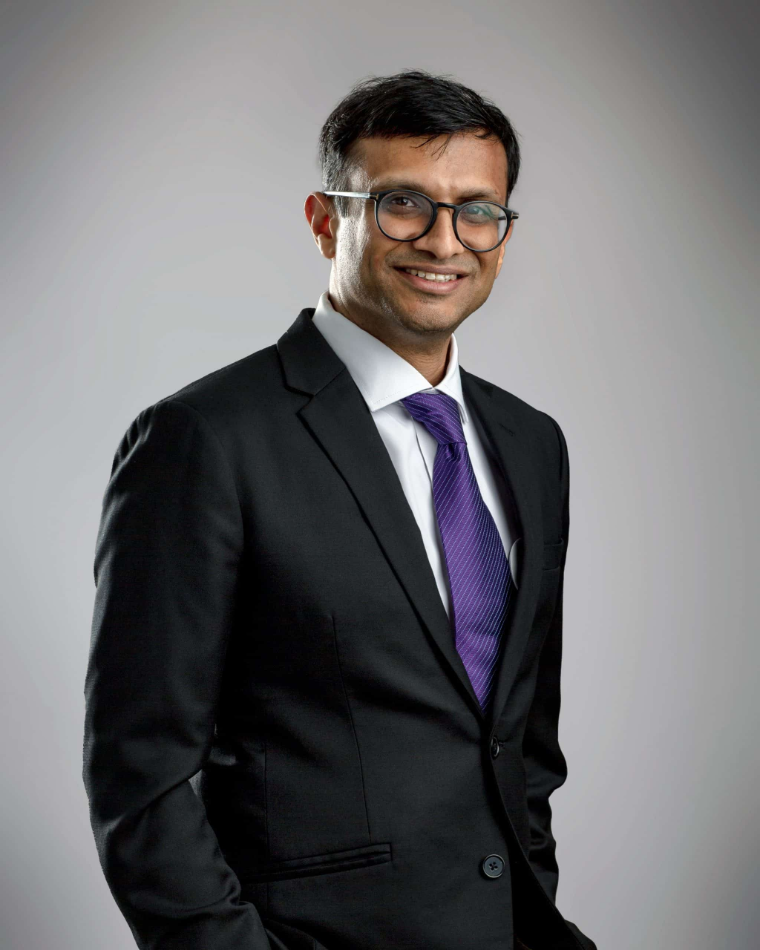
Sandeep is the Partner with 20+ years of experience in consulting and technology. He has expertise in multiple sectors including ecommerce, technology, telecom and private equity.
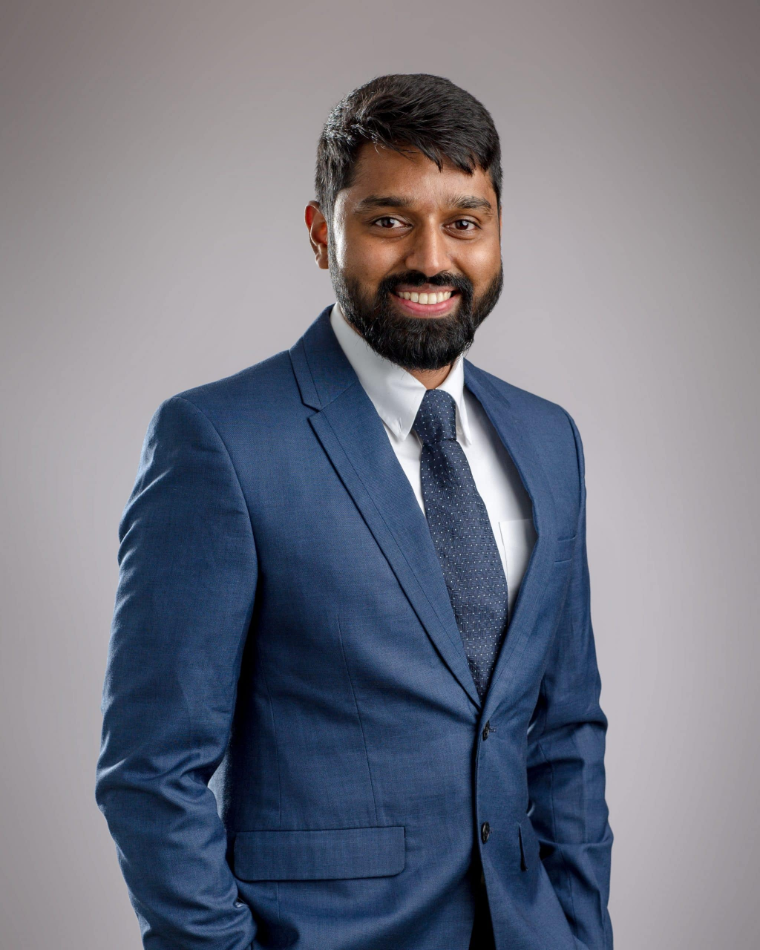
Akshay brings over a decade of experience across consulting and technology, with deep exposure to India, Southeast Asia and the Middle East. He has delivered multiple keynotes, served on industry panels, and is frequently quoted by leading Middle East media on the digital economy.